Bug report #21451
Quantile (Equal Count) on given dataset generates a lot of zero-classes
| Status: | Feedback | ||
|---|---|---|---|
| Priority: | Normal | ||
| Assignee: | - | ||
| Category: | Symbology | ||
| Affected QGIS version: | 3.7(master) | Regression?: | No |
| Operating System: | Easy fix?: | No | |
| Pull Request or Patch supplied: | No | Resolution: | |
| Crashes QGIS or corrupts data: | No | Copied to github as #: | 29268 |
Description
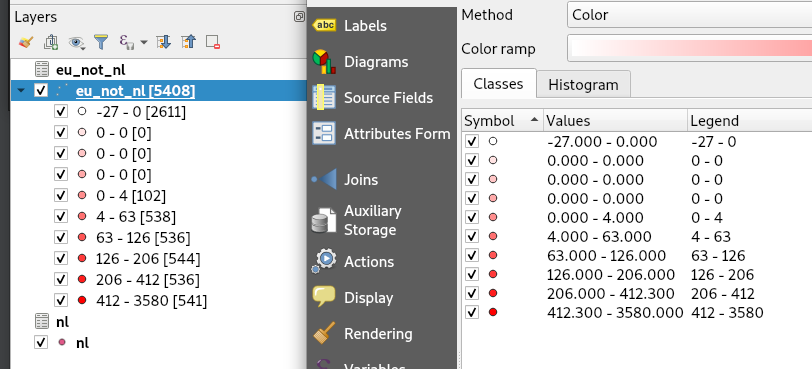
Using attached randomized dataset (with a lot of zero's AND negative values...) Graduated styling with the Quantile (Equal Count) on the 'value' column creates a lot of '0'-classes:

Adding more classes also adds more 'zero'- classes.
Maybe it has something to do with the amount of zero in the values?
Or with the negative values in it?
Or is there some logarithmic logic in it (where there should be no negative values)?
I've also tested with QGIS 2.18 and that gave the same results.
History
#1
 Updated by Nyall Dawson almost 7 years ago
- Status changed from Open to Feedback
I don't think this is a bug -- looking at your data distribution, it's impossible to partition into 10 equal sized groups.
#2
 Updated by Richard Duivenvoorde almost 7 years ago
@nyall: agreed.
Will leave it open for now, to ask a R-adept to see what R does in cases like this: take the 'same' buckets together, or create more buckets but arrange the values over it.
#3
 Updated by Pedro Venâncio almost 7 years ago
Hi Richard,
This is the correct result.
The R output is:
> table_random <- read.csv("\\random.csv")

> quantile(table_random$value, probs = seq(0, 1, by= 0.1))
    0%    10%    20%    30%    40%    50%    60%    70%    80%    90%   100%
 -27.0    0.0    0.0    0.0    0.0    4.0   63.0  126.0  206.0  412.3 3580.0
#4
 Updated by Richard Duivenvoorde almost 7 years ago
Hi Pedro,
Cool thanks! This is about creating the breaks isnt it? So QGIS does exactly the same.
But how does R divide the values then over the buckets? As you see in the QGIS screenie all values are put in the first 'zero'-bucket.
OR is this just a 'dumb' question, as you should just not use this method for such data.
#5
 Updated by Pedro Venâncio almost 7 years ago
- File random_abs_freq.ods added
Hi Richard,
There are several forms to calculate quantiles. R implements, by default, the types described here:
https://www.rdocumentation.org/packages/stats/versions/3.5.2/topics/quantile
The "problem" with your dataset is that the value "0" (zero) is repeated much more (2605 of 5408) than any other value.
Basically what quantile does is split the sample in n parts, in such a form that any part has the same amount of values. For instance, if you divide in 5 parts, each part should became with 20% of the sample (in your case, points).
The easiest way to check the percentiles/quantiles in a spreadsheet is to calculate the absolute frequency, then the relative frequency, and then the cumulative relative frequency. After you have this, you just check the breaks, finding the value that match the cumulated relative frequency you are looking for (the percentile). Please see the spreadsheet attached with your data. For instance, the value that corresponds to cumulated relative frequency 0 is -27 (minimum); 0.5 is 4; 0.6 is 63; and so on. But as 0 has a relative frequency of more than 0.48, it includes the percentile 0.1, 0.2, 0.3 and 0.4.
So, with this distribution of data, or you reduce the number of classes used by quantile, or it is better to use another method.