Bug report #8702

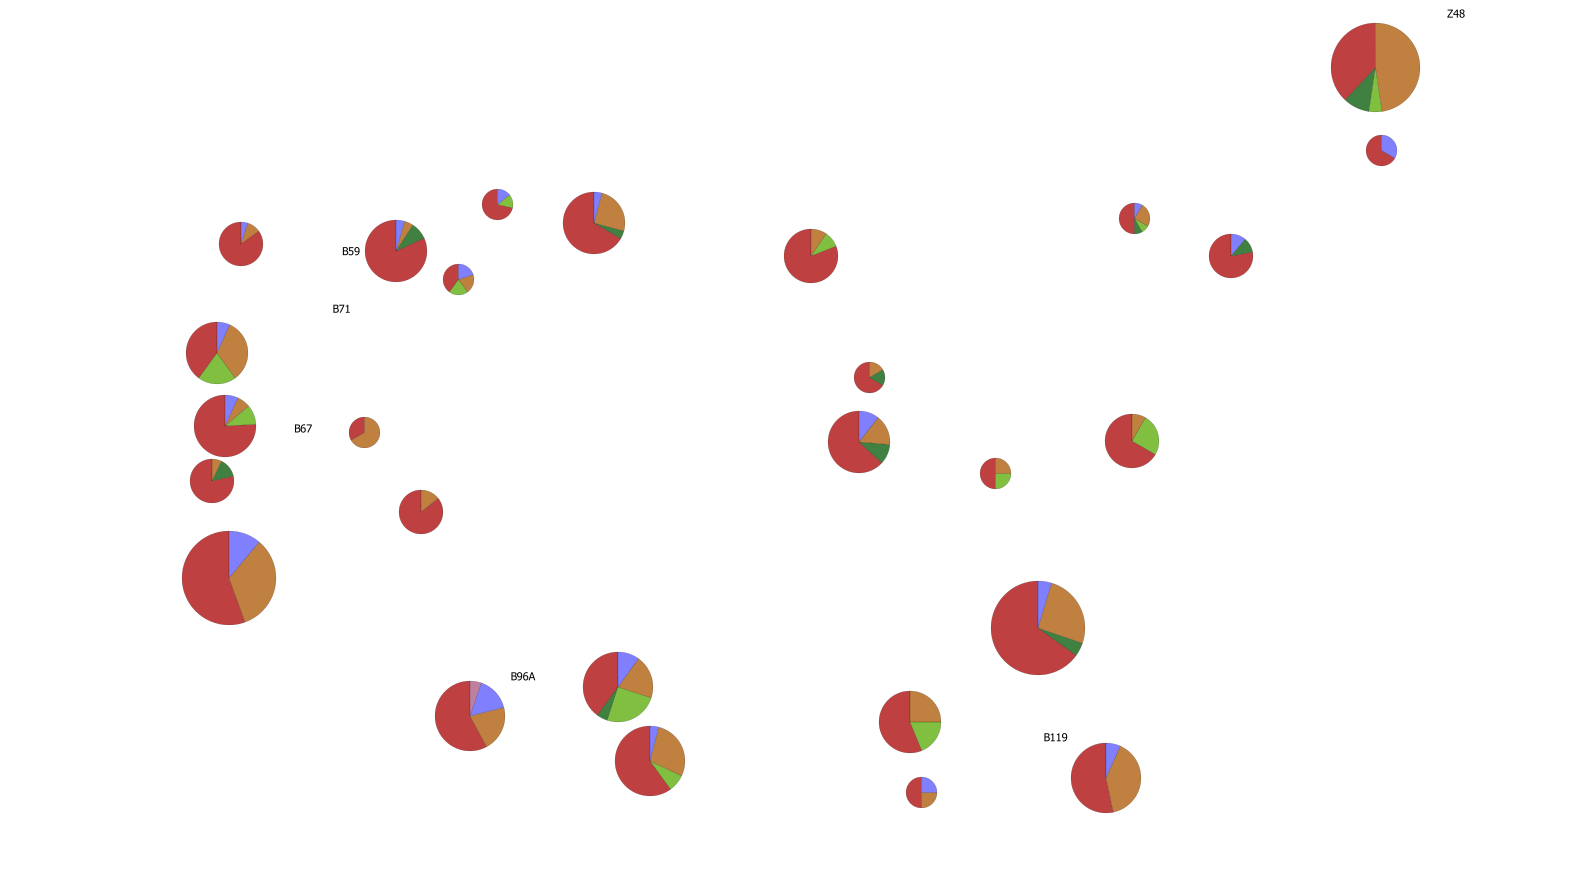
chaotic pie charts
| Status: | Closed | ||
|---|---|---|---|
| Priority: | Normal | ||
| Assignee: | - | ||
| Category: | Browser | ||
| Affected QGIS version: | 2.0.1 | Regression?: | No |
| Operating System: | MS Windows | Easy fix?: | No |
| Pull Request or Patch supplied: | No | Resolution: | |
| Crashes QGIS or corrupts data: | No | Copied to github as #: | 17422 |
Description
In Qgis 2.01 pie charts do not appear for every data point. It depends on map scale and scaling method, when charts are not scaled, they appear for every point (sometimes). Data are stored in postgresql, values and data formats are correct.
History
#1
 Updated by Paolo Cavallini over 12 years ago
See #8706
#2
 Updated by Matthias Kuhn over 12 years ago
QGIS tries by default to only show non-colliding diagrams.
To have all diagrams showing regardless of collisions go to "Position" > "Automated Placement Settings" and check "Show all labels and features"
#3
Updated by Matthias Kuhn over 12 years ago
- Status changed from Open to Closed