Bug report #11955

Qgis Diagram not showing output for one specific countie - at 1:3,000,000 zoom
| Status: | Closed | ||
|---|---|---|---|
| Priority: | Normal | ||
| Assignee: | - | ||
| Category: | Diagrams | ||
| Affected QGIS version: | 2.6.0 | Regression?: | No |
| Operating System: | Windows | Easy fix?: | No |
| Pull Request or Patch supplied: | No | Resolution: | |
| Crashes QGIS or corrupts data: | No | Copied to github as #: | 20163 |
Description
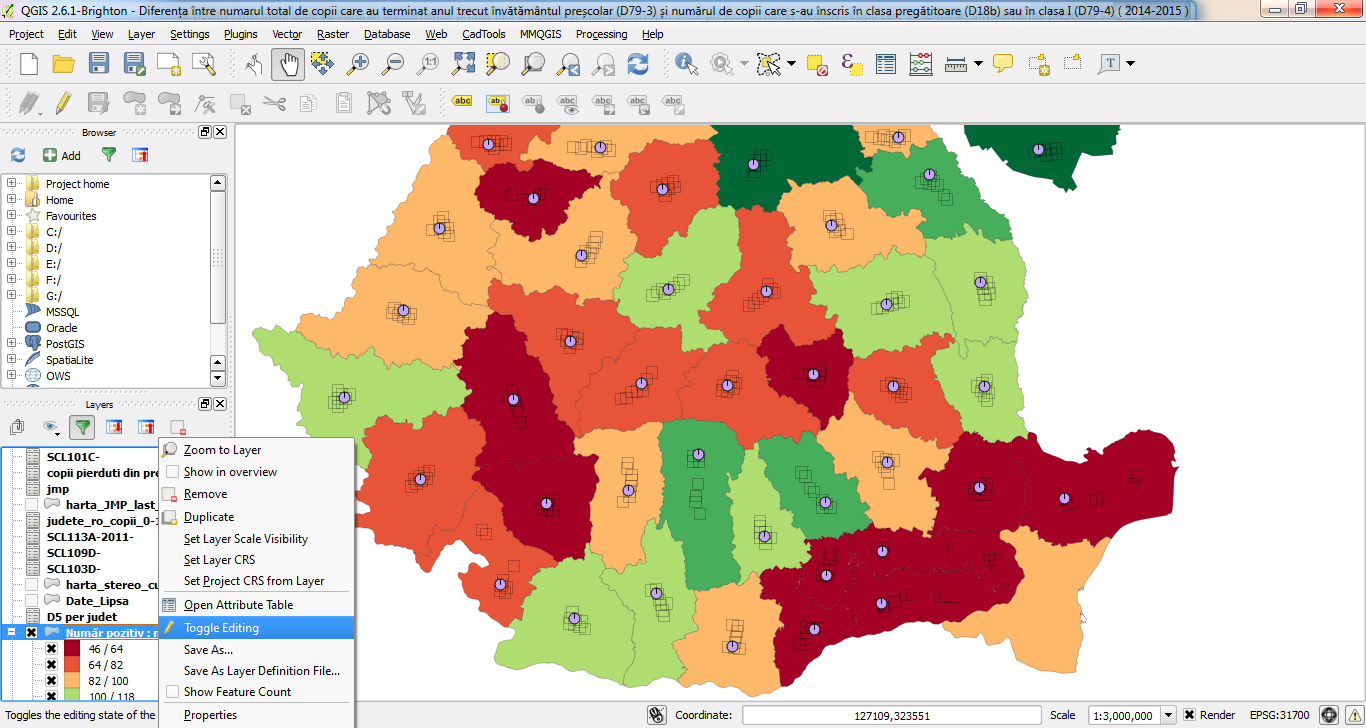
I think this is a bug, i tried to resize, to make the piechart smaller, it will not show even if i try everything, only for Constanta countie ( i have attached the file )
Steps to replicate.
Load the SHP
Go to map scape 1:3,000,000
Activate a diagram, it can be a pie chart or anything else.
All the piecharts will be created, with the exception for the one associated with Constanta
If you zoom in , then it will show also for Constanta.
Associated revisions
Fix diagrams not respecting canvas rotation
Also fixes diagrams not showing for invalid polygons (fix #11955)
History
#1
 Updated by Nyall Dawson about 11 years ago
- Status changed from Open to Closed
Fixed in changeset 7c7ef6d8cdfc547c8bafc9b36c2848c17239a259.