Feature request #6754

Add logarithmic distribution to raster symbology
| Status: | Open | ||
|---|---|---|---|
| Priority: | Normal | ||
| Assignee: | - | ||
| Category: | Rasters | ||
| Pull Request or Patch supplied: | No | Resolution: | |
| Easy fix?: | No | Copied to github as #: | 15910 |
Description
see for example here
http://wiki.gis.com/wiki/index.php/Geometric_Interval_Classification
"This classification method is used for visualizing continuous data that is not distributed normally".
The method id already implemented (as "log sitribution") in a QGIS plugin called "1 band color table" available in this repo
History
#1
 Updated by Giovanni Manghi about 9 years ago
- Easy fix? set to No
#2
 Updated by Richard Duivenvoorde over 8 years ago
- Description updated (diff)
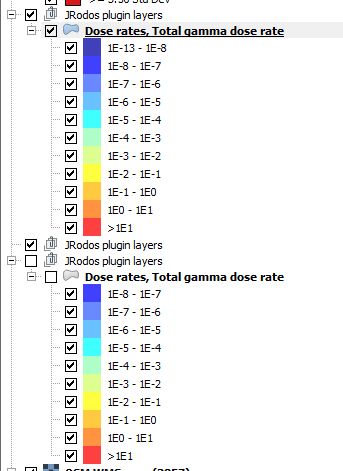
- File logscale.jpg added
I was looking for a logarithmic (ten) scale for vector data too...
I think (for vector data) it would need some inputs though, like:
- number of classes
- minimum exponent (optionally based on data minimum)
- maximum exponent (optionally based on data minimum)
- if minimum and maximum should be ranges or just 'bigger then' and 'smaller then' as borders of the ranges
A nice default color ramp to use would be range between HSV colors between 0 and 0.6 (see screendump for examples):
see http://doc.qt.io/qt-4.8/qcolor.html about HSV coloring
But should maybe be a separate feature request :-)