Bug report #20472

QML Bar Chart y-axis min-max wrong
| Status: | Closed | ||
|---|---|---|---|
| Priority: | Normal | ||
| Assignee: | |||
| Category: | Forms | ||
| Affected QGIS version: | 3.4.1 | Regression?: | No |
| Operating System: | Easy fix?: | No | |
| Pull Request or Patch supplied: | No | Resolution: | |
| Crashes QGIS or corrupts data: | No | Copied to github as #: | 28292 |
Description
The minimum and maximum values for the y-axis of the QML bar chart does not work if data-defined values are used. The maximum hard-coded number is used instead. If no hard-coded number is preset, the default extent from -0.5 to 0.5 is shown.
See the attached screenshots (and used dataset)!
info_tool_with_error.PNG - Wrong chart in object attribute form (29.4 KB)
qml_chart_editor.PNG - Chart view in qml widget editor (52.4 KB)
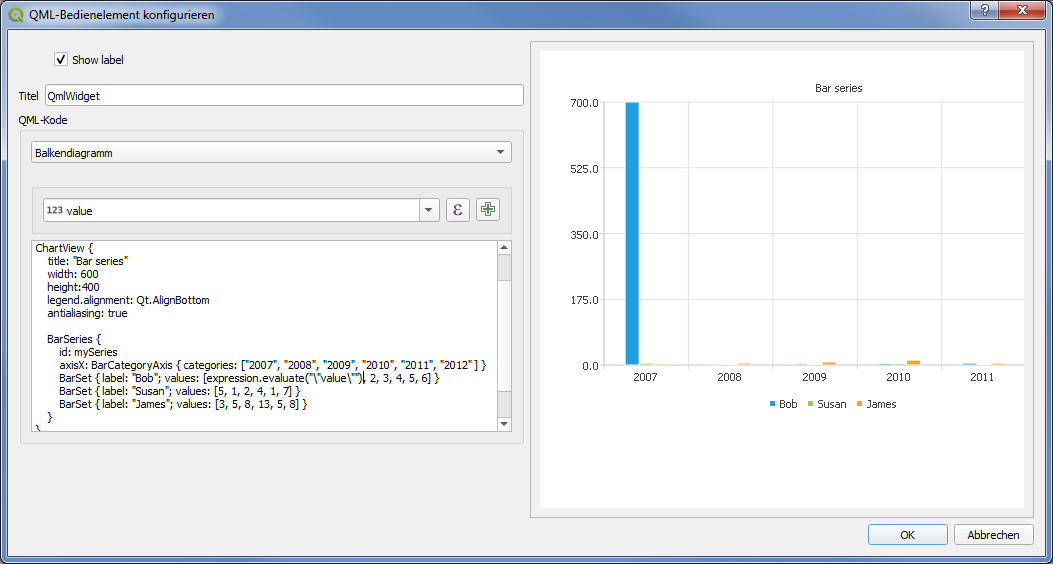
qml_chart_error.csv  - Dataset to reproduce error
(126 Bytes)
- Dataset to reproduce error
(126 Bytes)
Associated revisions
use valueAxis in qml example
fixes #20472
History
#1
 Updated by Giovanni Manghi about 7 years ago
- Operating System deleted (
Win 7)
#2
 Updated by Simon Gröchenig about 7 years ago
- Assignee set to David Signer
@David, do you (as contributor of this feature) confirm this bug?
#3
 Updated by David Signer about 7 years ago
Thanks for reporting. I can confirm the behavior.
#4
Updated by David Signer almost 7 years ago
- % Done changed from 0 to 100
- Status changed from Open to Closed
Applied in changeset qgis|e8416661a4eb0e80edd6c9a112ffbff253d5e3ae.