Bug report #13639

'Identify Results' graph shows incorrect values for NaN
| Status: | Closed | ||
|---|---|---|---|
| Priority: | Normal | ||
| Assignee: | - | ||
| Category: | Unknown | ||
| Affected QGIS version: | master | Regression?: | No |
| Operating System: | Easy fix?: | No | |
| Pull Request or Patch supplied: | No | Resolution: | end of life |
| Crashes QGIS or corrupts data: | No | Copied to github as #: | 21675 |
Description
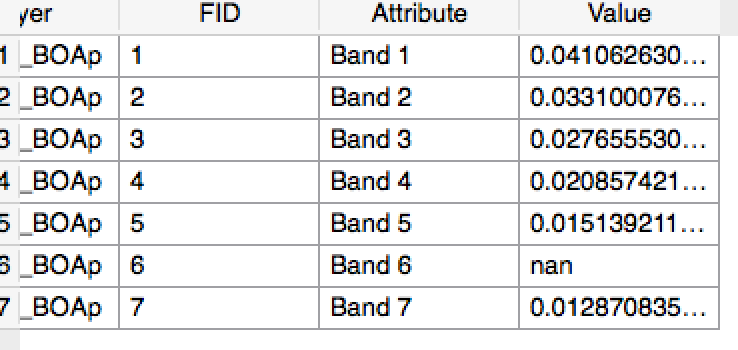
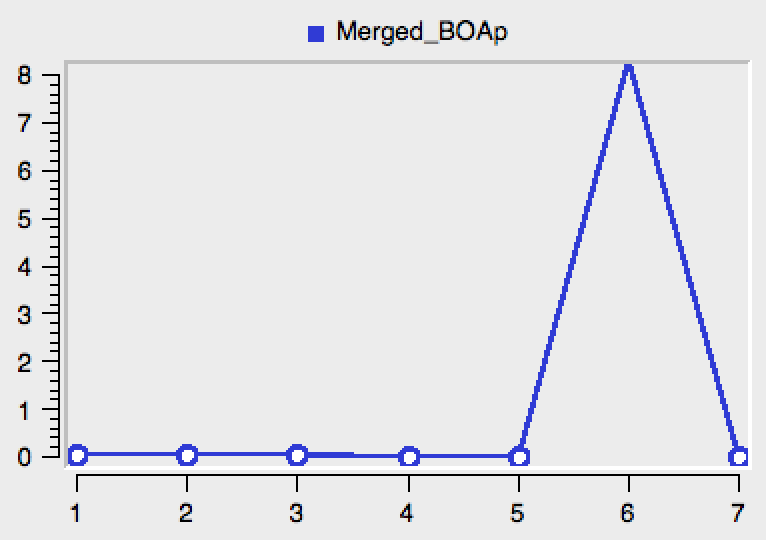
The graph view in the Identify Results window is great - particularly for looking at satellite images. However, if any of the bands of an image have a NaN value then that point is shown very high - which makes it very difficult to see the pattern in the other points. Ideally, I think bands with values of NaN should be shown as blank (ie. no Y point for that X point).
See the two files attached for an example of the table and then the resulting graph.
This occurs in QGIS 2.10 and the latest nightly build.
History
#1
 Updated by Robin Wilson over 10 years ago
- File Screen_Shot_2015-10-20_at_11.02.16.png added
- File Screen_Shot_2015-10-20_at_11.02.07.png added
For some reason the files didn't upload the first time - here they are.
#2
 Updated by Giovanni Manghi almost 9 years ago
- Easy fix? set to No
- Regression? set to No
#3
 Updated by Jürgen Fischer over 8 years ago
- Category set to Unknown
#4
Updated by Giovanni Manghi almost 7 years ago
- Status changed from Open to Closed
- Resolution set to end of life
End of life notice: QGIS 2.18 LTR
Source:
http://blog.qgis.org/2019/03/09/end-of-life-notice-qgis-2-18-ltr/